Cite us
Should you find our software useful please cite:
Marco Pietrosanto, Eugenio Mattei, Manuela Helmer-Citterich, and Fabrizio Ferrè
A novel method for the identification of conserved structural patterns in RNA: From small scale to high-throughput applications
Nucl. Acids Res. (14 October 2016) 44 (18): 8600-8609 first published online August 31, 2016 doi:10.1093/nar/gkw750
Download citation in RIS format.
and
Marco Pietrosanto, Marta Adinolfi, Riccardo Casula, Gabriele Ausiello, Fabrizio Ferrè, Manuela Helmer-Citterich;
BEAM web server: a tool for structural RNA motif discovery,
Bioinformatics, Volume 34, Issue 6, 15 March 2018, Pages 1058–1060, https://doi.org/10.1093/bioinformatics/btx704
Download citation in RIS format.
File formats
Back to the top
FASTA files
The minimum number of sequences to be analyzed is 4.
The input sequences are accepted in multiFASTA format:
-The line containing the name and/or the description of the sequence starts with a ">";
-The words following the ">" are interpreted as the RNA id (avoid spaces);
-The second line reports the RNA nucleotide sequence;
-The subsequent line characters are interpreted as secondary structure information in dot-bracket(Optional)
-A fourth line will be interpreted as BEAR notation (Optional)
Users can either input a file with only the primary sequences, as well as primary sequences and secondary structures in dot-bracket, or a full FastB file with primary sequences, dot-brackets and BEAR-encoded structures.
The IUPAC notation is accepted for nucleotides (case-insensitive).
Example of a well formatted input file:
>X06054.1/711637
GGGCCCGUCGUCUAGCCUGGUUAGGACGCUGCCCUGACGCGGCAGAAAUCCUGGGUUCAAGUCCCAGCGGGCCCA
In this case the secondary strucure for the sequence will be computed on the fly.
You can provide your own structures in dot bracket format,
>X06054.1/711637
GGGCCCGUCGUCUAGCCUGGUUAGGACGCUGCCCUGACGCGGCAGAAAUCCUGGGUUCAAGUCCCAGCGGGCCCA
(((((((..((((..........)))).(((((.......))))).....(((((.......)))))))))))).
or a full FASTB input with BEAR encoded structures (use the BEAR encoder)
>X06054.1/711637
GGGCCCGUCGUCUAGCCUGGUUAGGACGCUGCCCUGACGCGGCAGAAAUCCUGGGUUCAAGUCCCAGCGGGCCCA
(((((((..((((..........)))).(((((.......))))).....(((((.......)))))))))))).
GGGGGGG::ddddssssssssssdddd:eeeeepppppppeeeee:::::eeeeepppppppeeeeeGGGGGGG:
A typical input will contain many sequences e.g. :
>RNA_a
GCCUCAAAGUAUAUGGAAGAGUAAGCCUUCCAUCCGCCUACUAGUUAGAGUGACUAAAGCCGACCGAC
>RNA_b
GAUCGUAUGGAAGAGUAAGCCUUCCAUUUCAAUCUUCUCGCUGUCUAUAGUUAAGCUCCGCGUCGCGCUAGGCA
>RNA_c
GUUCUACCAGCGCCGUACGGUGUCCAGGGGGUAGGAAAAGCGGGACGUACUUCAUAGGAUCAUUU
>RNA_d
UCUGAAGGCCGCACAUCAAUGCACAUGGAAGAGUAAGCCUUCCAUUGCGGGUGCCGUACGCAUGUGACAUGCCUGC
BED files
The web server can accept BED files in a standard format (in this case users will have to choose the reference genome, the genomic regions on which to map the intervals and the extension desired (Remembering that the community accepted range of optimal folding is between 100-300 nt):
				chr1	155851218	155851462
				chr1	171556083	171556327
				chr1	183100344	183100590
				chr3	198290264	198290508
				...		...		...
The genomic intervals will undergo:-
sorting, via bash sort
-
intersect with GTF, via bedtools intersect
-
selection of region, via awk scripting
-
extension of the reads, via bedtools slop
-
FASTA extraction, via bedtools getfasta
At this point the FASTA file will be treated as other FASTA, by using a secondary structure prediction tool (RNAfold or RNAstructure - the latter is discouraged for more than ~1000 RNAs -), the BEAR encoder and finally BEAM.
How to use it
Back to the top
Min motif width:
Minimum stretch of nucleotides considered for the motif model;
Max motif width:
Maximum stretch of nucleotides considered for the motif model;
#motifs:
Number of motifs given in output;
Fold:
Type of secondary structure prediction method. BEAM Web Service offers two kinds of prediction methods:
Advanced Options:
Clean:
Controls the amount of structural variability tolerated in the motif model; it changes the threshold above which considering an RNA with motif (90%/50%/0% from the mean partial score of the model)
Annealing Steps:
Steps required to reach T=0;
Total Steps:
Total steps for simulated annealing plus gradient descent;
Starting Temperature:
Virtual temperature that decreases over time, it controls the probability of acceptance of "bad" moves;
Model limit:
Influences the max number of structures that can form a model. Even for big datasets it is advisable not to go over 200, for computing reasons;
Cooling:
Absolute amount of Temperature that is reduced each step (Linear Cooling);
Random Starts:
Use R random starting points and choose the highest score for each motif;
Consider unpaired Branch:
Weight less (similarity score(:,:)=0) the branch alignments (it fosters hairpins);
Keep all the runs:
Keep all the runs (for R>1), otherwise only keep best for each motif.
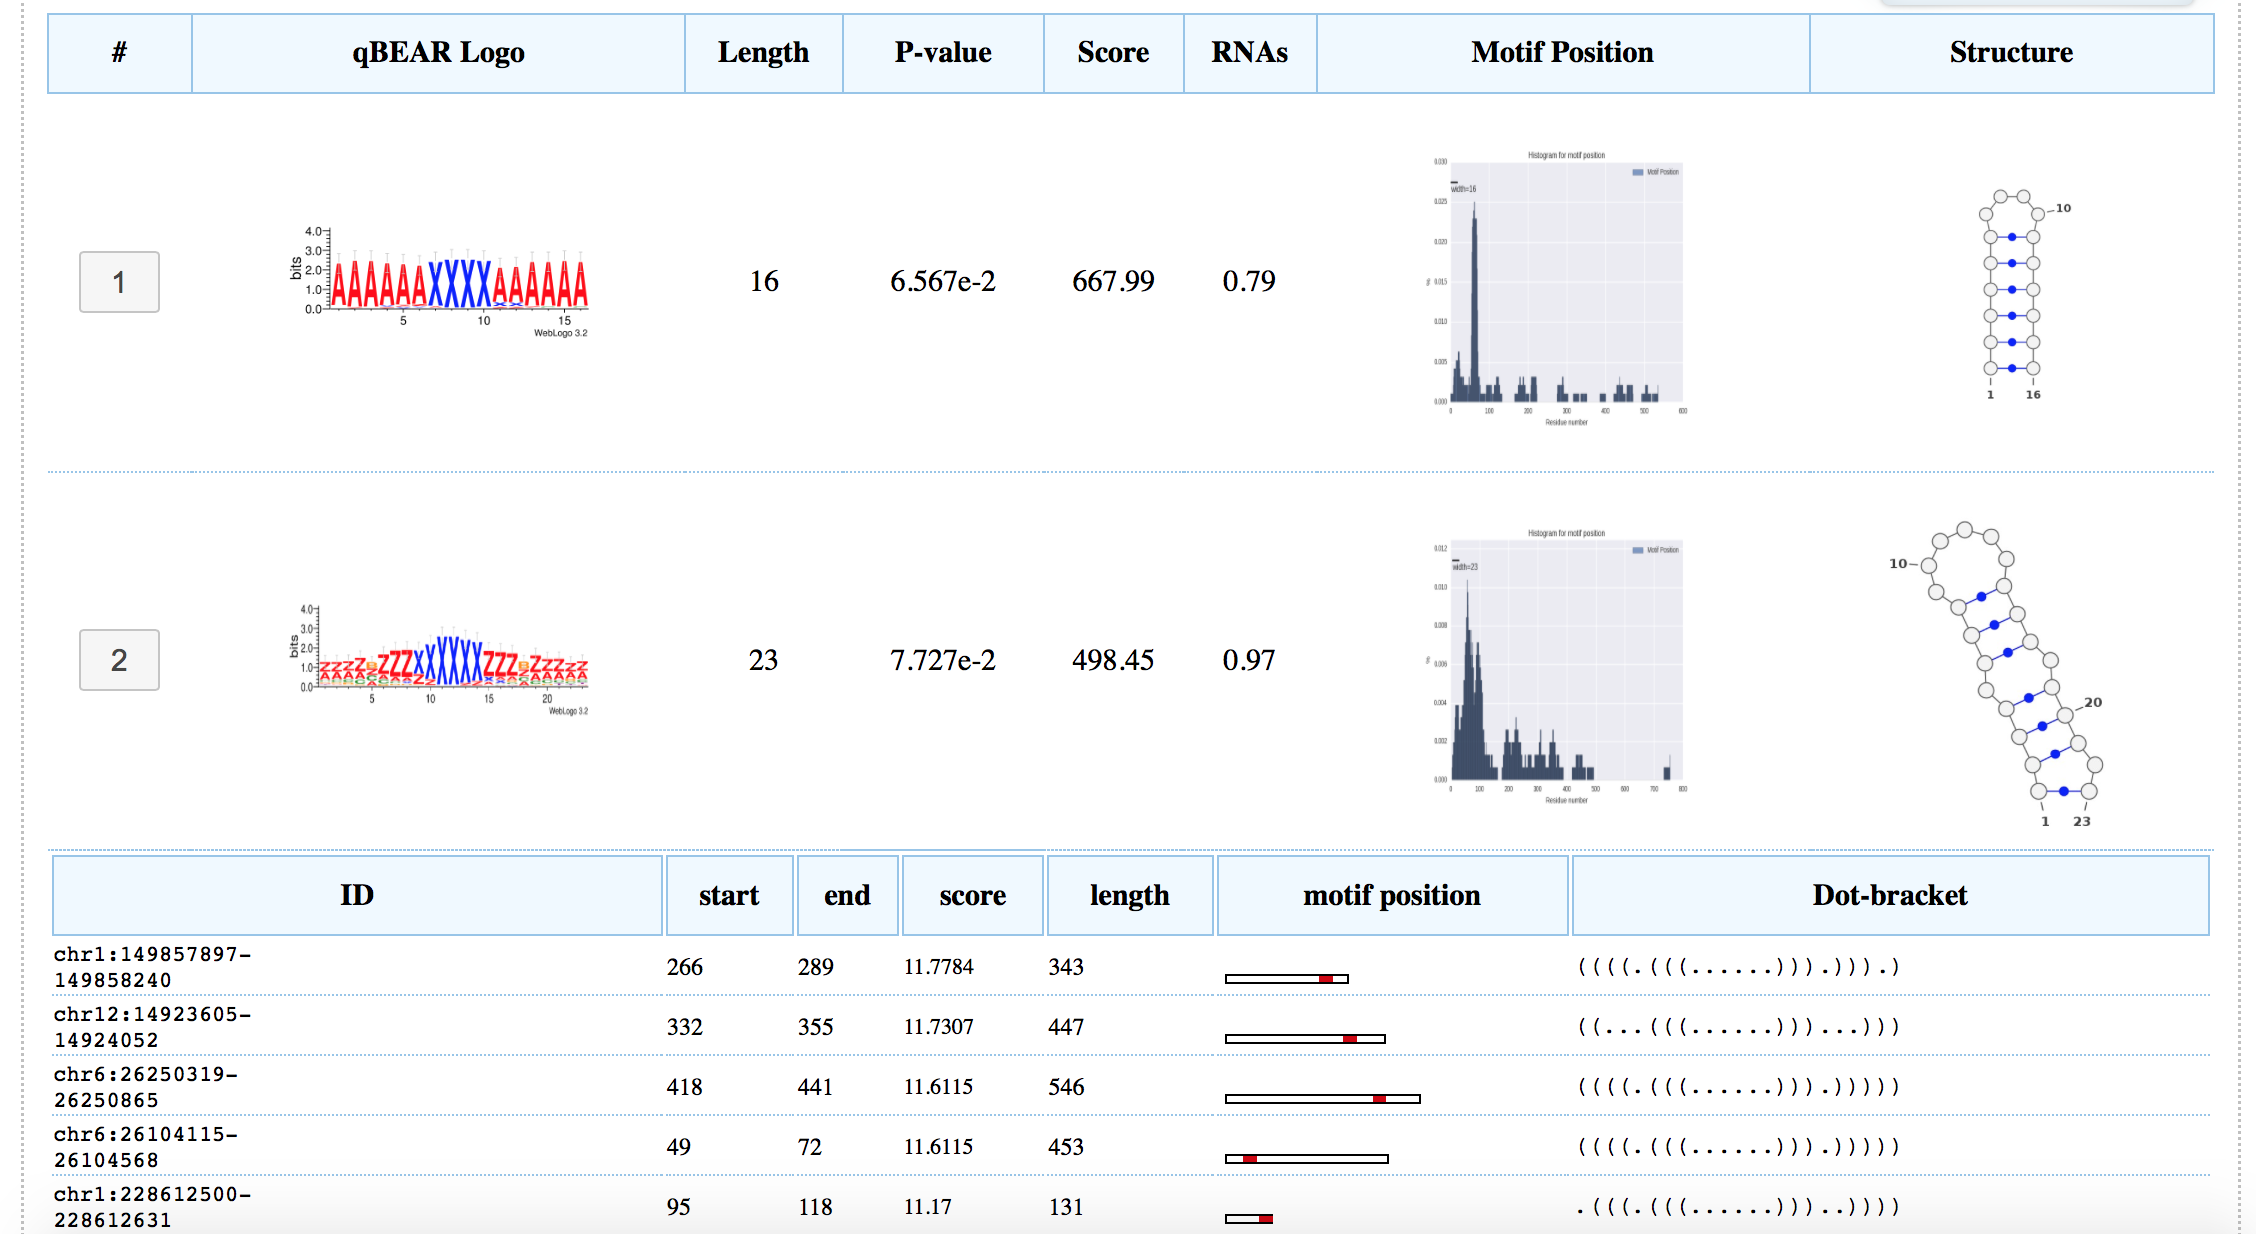
The results page reports a table containing all the motifs found. The table has 1 row per motif found. The 8 columns will report: the number of the motif as in the BEAM output, a Logo representation in qBEAR characters, the Length of the motif model (in nucleotides), a p-value, the BEAM score, the number of RNAs that matched the motif, a histogram of the motif's start positions, where the X-axis has the absolute position in the RNA sequences and lastly, a structure depicted with
VaRNA (
Darty et al. 2009) of the most likely representation of the motif model. It is possible to expand the motif result by clicking on the motif number in the first column.
A list of all the sequences containing motif and a graphic illustration of the motif position related to the RNA's length, will be shown as displayed in the picture below:
Each image in the table can be zoomed in other page by clicking on it.
Results can be downloaded in zip format. A readme file will be there to help you read them.
What is Beam?
Back to the top
BEAM (BEArMotif finder) is a method that explores sets of unaligned RNAs sharing a biological property
(e.g. the ability to bind a specific RNA-binding protein) looking for the best local secondary structure motifs,
and evaluating their significance with respect to a common background. BEAM is able to identify structurally similar sites shared by
hundreds or thousands of RNAs, and the extension of the motifs is not subject to limitations (other than those imposed by the user).
Hence, it is a tool suitable for low- , medium- and high-throughput settings such as those in CLIP-seq analysis.
How it works
Back to the top
Beam description
BEAM employs the BEAR secondary structure notation (Mattei et al. 2014) and its associated similarity matrix of secondary structure elements,
in order to capture motifs by structural similarities that derive from evolutionary related ncRNAs in a way that covers
topological comparison, yet expands it by considering the evolutionary history behind the abstraction of structure representation.
BEAMfollows a heuristically tweaked simulated annealing algorithm to look for the system state A having the best score BS(A).Given N BEAR-encoded RNA
secondary structures, a random initial state is drawn.
From there, and for a fixed maximum number of steps (or until score con- vergence), a random perturbation is drawn from a uniform distribution
(a flowchart is shown in the figure below).
Every motif is reported as its PFM and its consensus, using for clarity a simplified version of the BEAR alphabet denoted as
qBEAR(quick BEAR), and its significance is evaluated on a background distribution
Automatic Background generation
If a user provides no background against which evaluating statistical significance of putative motifs, BEAM is equipped with a feature that generates an automatic
background. The resulting file is composed by RNAs taken from Rfam seed data, with a filter that guarantees similar length and amount
of structuration with respect of the input provided. To maintain a heterogeneous set no RNAs from the same family is chosen. This limits the background size to 250 elements
(190 for input sets with mean length that is over 500nt) but does not hinder the method efficiency since the background is used to estimate a Gaussian model of the background
scores.
For more information and algorithm details see
Pietrosanto et al. "A novel method for the identification of conserved structural patterns in RNA: From small scale to high-throughput applications." Nucleic Acids Research (2016)
BED to motif pipeline
Back to the top
The Web Server goal is to provide a fast access to preliminary results about RNA secondary structure motifs. This pipeline aggregates a series of steps that are usually taken to go from mapped reads (e.g. from a CLIP-Seq experiment) to putative structural motifs of interaction.
Starting from the BED file we intersect the genomic intervals with one of three available genomes (hg19, hg38, mm9) in order to filter the reads for their genomic location (UTR, CDS, whole transcript), then we extend the reads (usually ~30nt) by a user-defined quantity (default: 50, both sides). The sequence is extracted in Fasta format from the corresponding genome. After folding all the sequences, the resulting data is encoded in BEAR alphabet and then passed on to BEAM for motif discovery.
Reading qBEAR logos
Back to the top
How to interpret a qBEAR logo:
We are all accustomed to reading a sequence Logo, but with the advent of the new RNA structural alphabet (BEAR), several new visualizations are made possible, and this is a guide to interpret one of those.
The first thing to remember is that qBEAR is not BEAR, but its simplification. It is only a visual escamotage used to simplify an otherwise fuzzy logo output.
The way to remember how qBEAR works is by visualizing a keyboard: every column is a structural element, divided in three groups of lengths (when appliable).
The three groups are divided in short, medium and long for the structural elements that allow it. Bulges and unpaired branching are defined by only one character each.
Colors are used to better distinguish class differences. Same color = Same structural class (possible different lengths).
Now for a practical example:
The Blue 'X's in the middle inform us of a (well defined) 6 nucleotides loop.
A 5 nt short stem (red 'Z's) closes the loop.
Now for the interesting part: we are used to read a superposition of characters in logo representations by understanding that two (or more) characters may appear in that place. For nucleotides the interpretation is straightforward, but for structure elements?
In this case there is a superposition between a 3-nucleotides internal loop (green 'C's) and a BZB (Bulge, Short stem (1 nt), Bulge). The interpretation here is that there are two or more 'structurally similar' (Substitution matrix speaking) elements that form this model. In this case a 3-nt internal loop OR a Bulge-Stem-Bulge.
In principle we could think at every other possible combinations of the two groups of letters (CZB, BZC, CCZ, ZBC, ZCC, CBZ), but in reality we can rule out some of these because there would not be any sense in a internal loop linked to a bulge (CB or BC).
In this case other possible structures may include ZCC or CCZ, that is a longer Stem at the 5' or 3' end of the shorter Internal Loop.
In terms of 2D secondary structures plots this ambiguity has no way to be resolved but to plot the different possible structures. A method that actually prints all the possible structures in one place would be necessary.
The full set of options used with weblogo is:
-C red ZAQ 'Stem' -C blue XSW 'Loop' -C forestgreen CDE 'InternalLoop' -C orange VFR 'StemBranch' -C DarkOrange B 'Bulge' -C lime G 'BulgeBranch' -C purple T 'Branching' -C limegreen NHY 'InternalLoopBranch' --composition 'none'
Supplementary Information - Folding Time
Back to the top
Should you need to use the integrated folding methods of this web server, please take into account a longer processing time and stricter limits. The time needed for BEAM in standard conditions (motif width 10-40nt, 3 motifs), as reported in (Pietrosanto et al., 2016), is generally lower than the folding time (this is true especially for RNAstructure).
The following plots show how much time do RNAfold and RNAstructure take to fold sets of 1k to 100k RNA sequences of different length (up to 2000nt). With dashed lines the time needed to BEAM to process the data and return 3 motifs.
For this reasons, limits are imposed for certain options, as per this table
| Software Requested |
Max #RNAs |
Max RNA length |
| RNAfold |
100000 |
500 |
| 500 |
2000 |
| RNAstructure-MEA |
50000 |
500 |
| None (input already has dot-bracket) |
500000 |
2000 |
The BED-to-motif pipeline usually requires little time with respect to the folding time shown above. The times are usually within some minutes at most (Slop extensions shown are limited to 150 nt because it is not advisable to go over a total of 300 nt extension due to prediction algorithm limits)